|
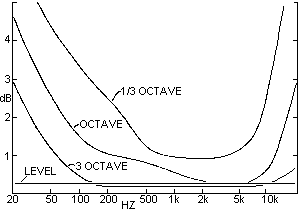
Each curve indicates the smallest amount of amplitude difference at each frequency that has been heard in ABX tests, when the bandwidth of the difference is about that of the curve's name. That is if you compare the frequency responses of two audio components and find the difference curve would fall below the criteria implied by all of the curves, the difference would probably not be heard in an ABX comparison. Differences that exceed any curve would almost certainly be audible. Thus each curve is the maximum amount of difference that should be tolerated in an ABX test intended to reveal other sorts of audible differences. For example, the "3-Octave" curve shows the threshold for errors about three octaves wide. Clearly for narrow-band errors and errors at the frequency extremes, matching is less critical. The "Level" curve shows that overall gain matching is most important for good comparisons of other factors. (This is figure 2 in Clark's AES paper.)
|
